Statistical Bulletin on National Economic and Social Development of Nanning in 2021
2021Year,The whole cityAll levels and departmentsAdhere to the guidance of Socialism with Chinese characteristics Thought of the Supreme Leader in the New Era, thoroughly study and implement the spirit of the important instructions of the General Secretary of the Supreme Leader on Guangxi’s work series, especially to inspect Guangxi.“four?27The spirit of the important speech closely revolves around the construction of magnificent Guangxi proposed by the twelfth Party Congress of the autonomous region.1+1+4+3+N"The target and task system, adhering to the policy as the priority, the project as the king, the environment as the foundation and innovation as the priority, coordinating epidemic prevention and control and economic and social development, fully implementing the strategy of strengthening the capital, stabilizing the basic economy and maintaining the overall social harmony and stability, made a good start in the Tenth Five-Year Plan.
I. Synthesis
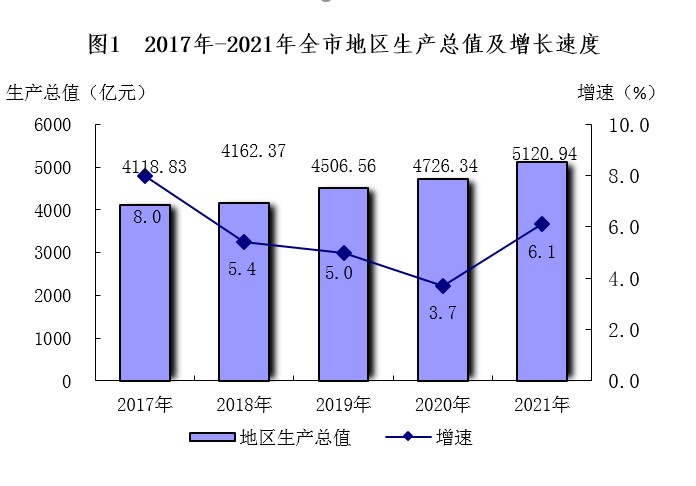
economic growth:Preliminary accounting, annual GDP5120.94Billion yuan, calculated at comparable prices, an increase over the previous year.6.1%. Among the three industries, the added value of the primary industry606.76Billion yuan, growth7.9%; Added value of secondary industry1198.76Billion yuan, growth4.3%; Added value of tertiary industry3315.42Billion yuan, growth6.3%. ?
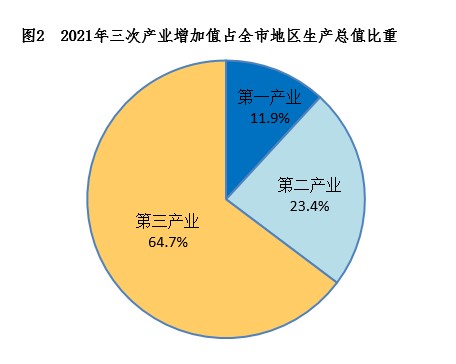
The proportion of the three industries is11.9:23.4:64.seven. and2020Year comparison, firstThe proportion of industry has increased0.55Percentage points, the proportion of the secondary industry rose.0.51Percentage points, the tertiary industryproportiondescend1.06Percentage points.
Population:By the end of 2021, the registered population of the city was 8,009,400, an increase of 95,600 or 1.2% over the previous year, of which the urban population was 4,199,800, an increase of 106,600 or 2.6%. At the end of the year, the resident population of the city was 8,832,800, an increase of 80,300 over the end of last year, including 6,164,000 urban residents, and the urbanization rate of the resident population was 69.79%, an increase of 0.88 percentage points over the end of last year. The city’s birth rate was 8.62‰, down 2.95 thousandths over the previous year. The population mortality rate was 5.3‰, down by 1.9 per thousand points over the previous year; The natural population growth rate was 3.37‰, down 2.8 thousandths over the previous year.
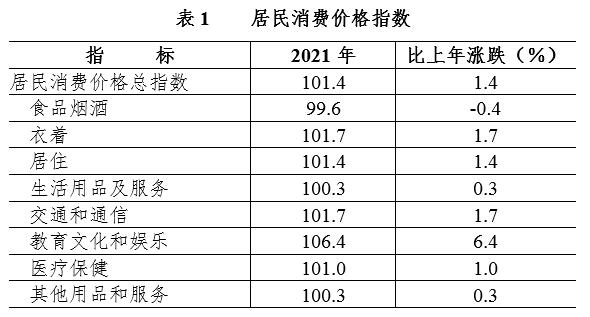
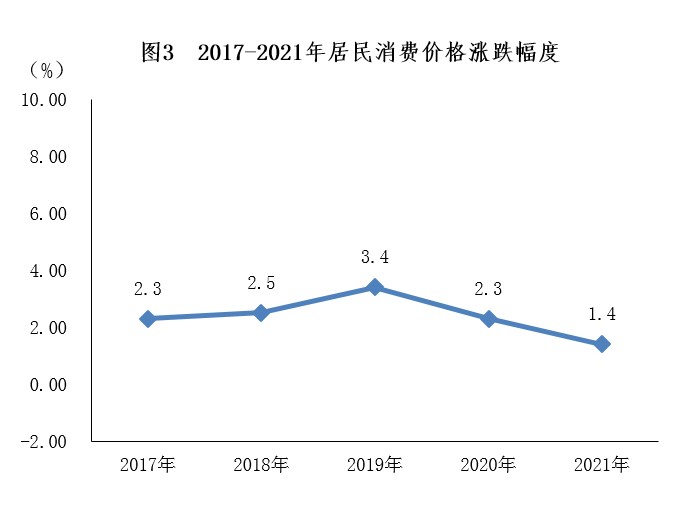
Price:The annual consumer price rose by 1.4% over the previous year. According to the classification, the eight categories of consumer price indices "rose by seven and dropped by one". (See Table 1.)
Second, the agricultural industry
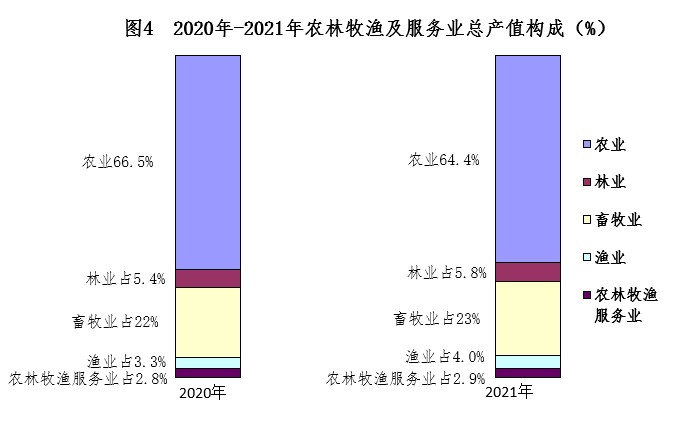
Output value:Agriculture, forestry, animal husbandry, fishery and services were realized throughout the year.The total industrial output value was 90.767 billion yuan, up by 9.1% over the previous year. Among them, the agricultural output value was 58.468 billion yuan, up 6.4% over the previous year; The forestry output value was 5.256 billion yuan, an increase of 6.5% over the previous year; The output value of animal husbandry was 20.842 billion yuan, an increase of 17.7% over the previous year; The fishery output value was 3.597 billion yuan, an increase of 4.1% over the previous year; The output value of agriculture, forestry, animal husbandry and fishery services was 2.604 billion yuan, an increase of 9.0% over the previous year. The proportion of agriculture, forestry, animal husbandry, fishery and service industry output value is: agriculture 64.4%, down 2.1 percentage points from the previous year; Forestry 5.8%, up 0.4 percentage points over the previous year; Animal husbandry was 23.0%, up by 1 percentage point over the previous year; Fisheries 4.0%, up 0.7 percentage points over the previous year; Agriculture, forestry, animal husbandry and fishery services accounted for 2.9%, up by 0.1 percentage point over the previous year.
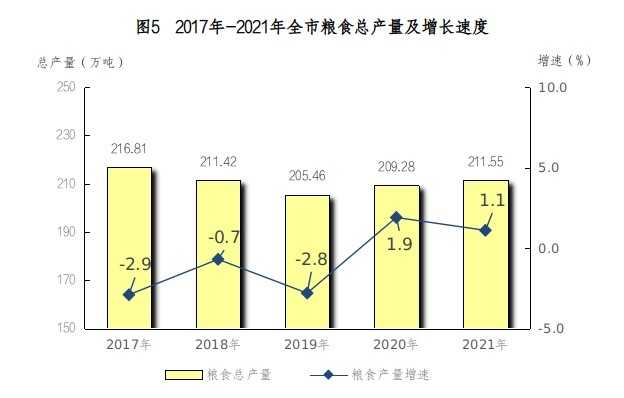
Crop planting area:The sown area of crops in the whole year was 14.587 million mu, down 0.4% from the previous year. Among them, the grain planting area was 6.3831 million mu, an increase of 0.26% over the previous year. The planting area of cash crops was 8,203,900 mu, down by 0.87% over the previous year, of which the planting area of sugarcane was 1,866,200 mu, down by 4.6% over the previous year; The oil planting area was 736,100 mu, down 2.7% from the previous year; The vegetable planting area was 4,164,600 mu, an increase of 1.7% over the previous year. The planting area of various cash crops accounts for 56.2% of the total sown area of crops, and the planting area ratio of grain crops and various cash crops is 1∶1.3 in the whole year.
Output of crop products:Total annual grain output2,115,500 tons, an increase of 1.1% over the previous year; The vegetable output was 6,836,900 tons, an increase of 4.06% over the previous year; The fruit output was 4,539,100 tons, an increase of 13.1% over the previous year; The output of sugarcane was 10.4962 million tons, down by 3.9% over the previous year. The output of peanuts was 149,500 tons, down by 1.3% over the previous year. Cassava output was 198,100 tons, down 6.7% from the previous year.
Output of aquaculture products:The annual meat output was 647,300 tons, an increase of 13.5% over the previous year, of which the pork output was 342,100 tons, an increase of 41.2% over the previous year; In the whole year, 4,324,100 pigs were slaughtered, an increase of 35.4% over the previous year; There were 2,655,600 live pigs, an increase of 16% over the previous year; The output of poultry eggs was 29,800 tons, an increase of 6.3% over the previous year; The milk output was 13,000 tons, down by 10.7% over the previous year; The output of aquatic products was 234,200 tons, up by 4.1% over the previous year.
Forestry production:The total amount of timber harvested in the whole society was 6,954,200 cubic meters, an increase of 10.4% over the previous year.
III. Industry and Construction Industry
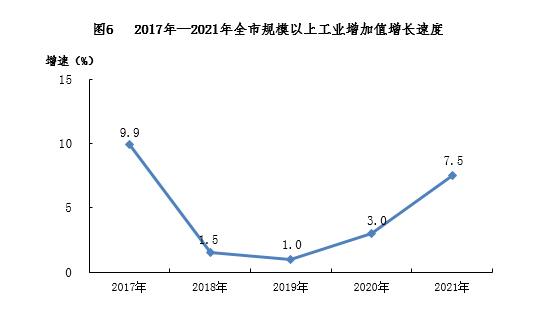
Industry:The added value of all industries in the whole year increased by 7.4% over the previous year, and the added value of industrial enterprises above designated size increased by 7.5% over the previous year. In terms of economic types, among the added value of industrial enterprises above designated size, state-owned enterprises decreased by 84.5%, collective enterprises increased by 13.8%, joint-stock enterprises increased by 7.8% and foreign-invested enterprises from Hong Kong, Macao and Taiwan increased by 10.5%. In terms of light and heavy industries, light industry increased by 10.6% over the previous year, heavy industry increased by 4.9% over the previous year, and the growth rate of light industry was 5.7 percentage points faster than that of heavy industry.
In the whole year, among the industries above designated size in the city, the added value of tobacco products industry increased by 10.2% over the previous year; The added value of computer, communication and other electronic equipment manufacturing industry increased by 19.6% over the previous year; The added value of nonmetallic mineral products industry decreased by 9.3 over the previous year.%; The added value of agricultural and sideline food processing industry increased by 16.4% over the previous year; The output value of power, heat production and supply industries increased by 22.2% over the previous year; The added value of wood processing and wood, bamboo, rattan, palm and grass products industries increased by 31.1% over the previous year.
The operating income of industrial enterprises above designated size in the city was 268.409 billion yuan, an increase of 9.48% over the previous year; The profit was 11.591 billion yuan, down 7.55% from the previous year. The annual production and sales rate of industrial enterprises above designated size was 97.3%, which was the same as that of the previous year.
At the end of the year, the city had industrial enterprises above designated size.Industry 1274, an increase of 178 over the previous year. Among them, there are 447 enterprises with industrial output value exceeding 100 million yuan.
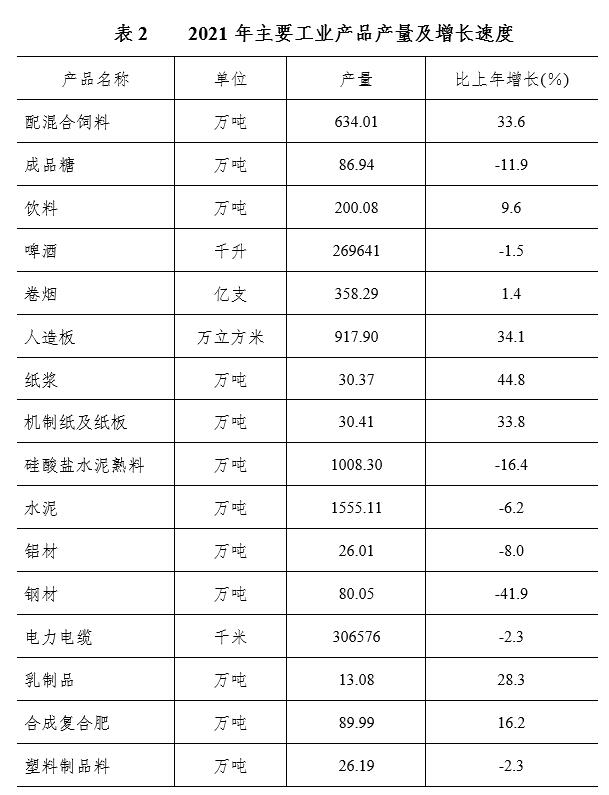
Output of main products (see Table 2).
Construction industry:At the end of the year, there were 545 qualified construction enterprises in the city, an increase of 48 over the previous year. The added value of the construction industry increased by 2.0% over the previous year. The construction output value of construction enterprises in the city was 264.771 billion yuan, an increase of 18.3% over the previous year.
???IV. Investment in fixed assets
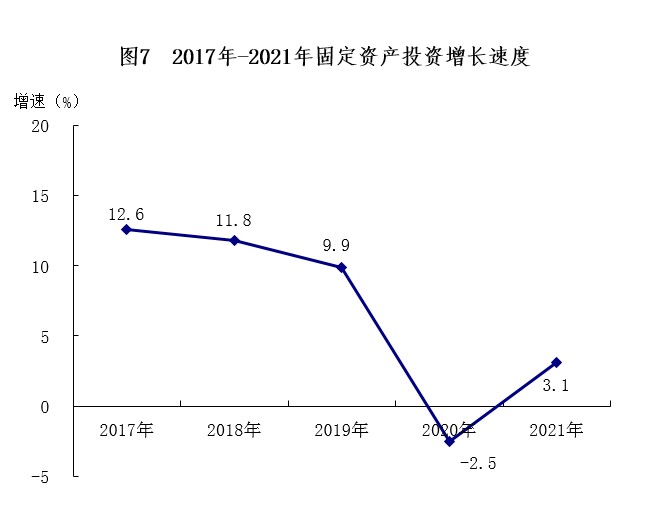
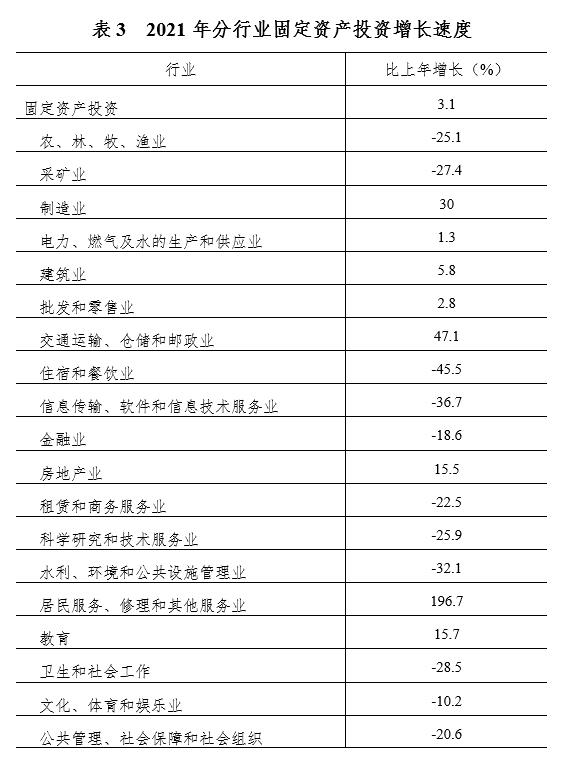
In 2021, the city’s investment in fixed assets increased by 3.1% over the previous year. Among them, the investment in the primary industry decreased by 26.0% over the previous year; Investment in the secondary industry increased by 20.2% over the previous year, of which industrial investment increased by 21.2% over the previous year; Investment in the tertiary industry increased by 1.5% over the previous year. Private investment decreased by 2.8% compared with the previous year.
In terms of investors, state-owned economic investment increased by 9.9%, collective economic investment decreased by 55.4%, private individual investment increased by 4.6%, investment from Hong Kong, Macao and Taiwan increased by 70.8%, foreign investment decreased by 51.6% and other economic investment decreased by 73.5%.
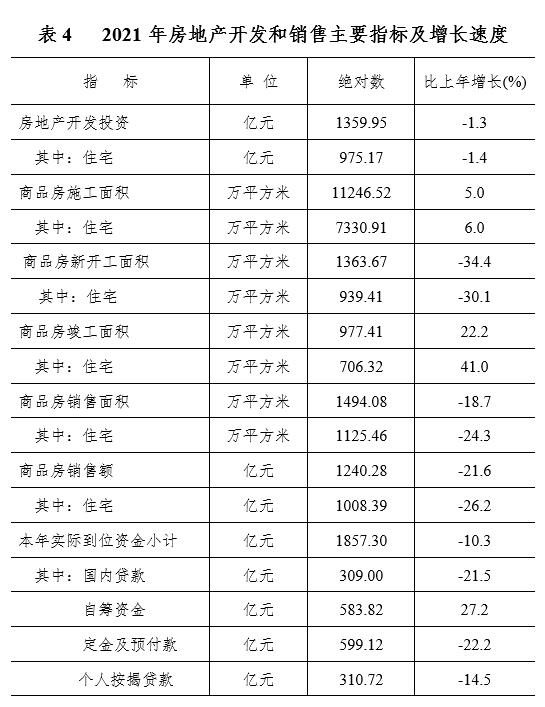
In the whole year, the investment in real estate development in the city was 135.995 billion yuan, down 1.3% from the previous year. Among them, the investment in commercial housing was 97.517 billion yuan, down 1.4% over the previous year; The investment in office buildings was 5.305 billion yuan, an increase of 5.4% over the previous year; Investment in commercial premises was 8.45 billion yuan, down 11.8% from the previous year. The construction area of commercial housing was 112.4652 million square meters, an increase of 5.0% over the previous year; The completed area of commercial housing was 9,774,100 square meters, an increase of 22.2% over the previous year; The sales area of commercial housing was 14,940,800 square meters, down by 18.7% over the previous year; The sales of commercial housing was 124.028 billion yuan, down 21.6% from the previous year. (See Table 4)
V. Domestic trade
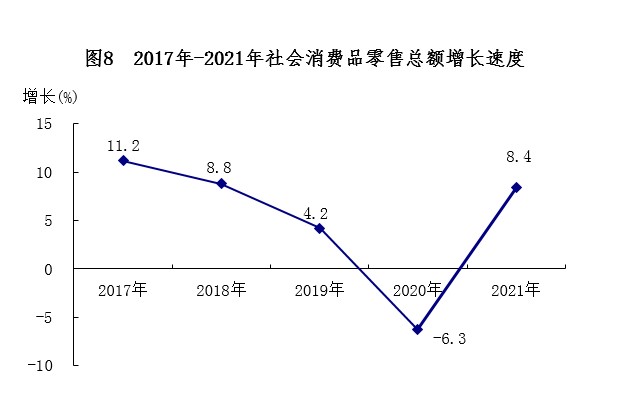
In the whole year, the total retail sales of social consumer goods in the city was 236.417 billion yuan, an increase of 8.4% over the previous year. According to the statistics of the location of the business unit, the retail sales of urban consumer goods was 215.316 billion yuan, an increase of 8.4% over the previous year; The retail sales of rural consumer goods reached 21.101 billion yuan, up 9.1% over the previous year. According to consumptionAccording to morphological statistics, the retail sales of commodities was 214.706 billion yuan, an increase of 7.8% over the previous year; The catering revenue was 21.711 billion yuan, an increase of 15.6% over the previous year.
Among the retail sales of enterprises above designated size, the retail sales of automobiles increased by 2.5%, household appliances and audio-visual equipment increased by 55.7%, communication equipment decreased by 4.3%, sports and entertainment products increased by 18.4%, cultural office supplies remained flat, furniture increased by 155.2%, building and decoration materials decreased by 17.7%, daily necessities increased by 0.7%, and grain, oil and food increased by 0.7%.The annual decline was 6.9%, tobacco and alcohol increased by 48.7%, clothing, shoes, hats and needles decreased by 1.9%, cosmetics decreased by 14.4%, gold and silver jewelry increased by 21.4%, and Chinese and western medicines increased by 3.8%.
????VI. Opening to the outside world
Foreign trade:The total value of foreign trade import and export in the whole year was 123.192 billion yuan, an increase of 24.9% over the previous year. Among them, the total export value was 58.195 billion yuan, an increase of 23.6% over the previous year; The total import value was 64.997 billion yuan, an increase of 26.0% over the previous year.
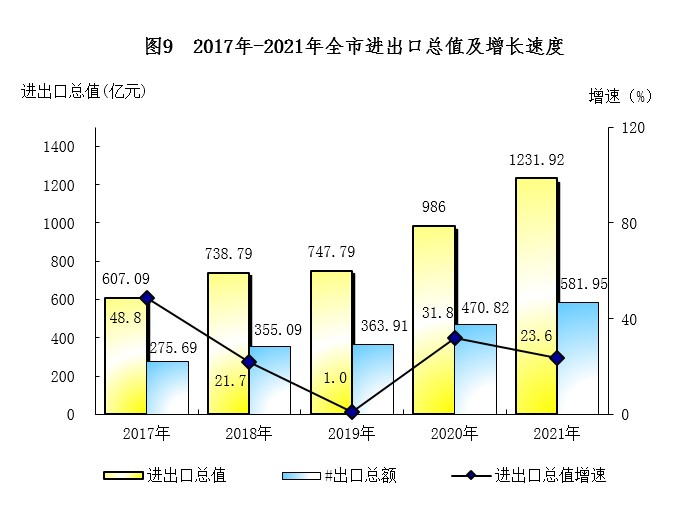
Investment attraction:In 2021, the actually paid-in capital was 88.107 billion yuan, down 24.2% from the previous year. In 2001, the actual utilization of foreign capital was 578 million US dollars, an increase of 31.3% over the previous year.
Development zone:At the end of the year, there were 43,724 enterprises in Nanning High-tech Industrial Development Zone, Nanning Economic and Technological Development Zone and Guangxi-ASEAN Economic and Technological Development Zone, an increase of 6,604 over the end of last year. Fiscal revenue was 11.07 billion yuan, an increase of 8.4% over the previous year; The total output value of industrial enterprises above designated size increased by 16.6% over the previous year; Investment in fixed assets increased by 17.8% over the previous year.
VII. Finance, Finance and Insurance
Fiscal revenue:The annual fiscal revenue was 82.884 billion yuan., an increase of 4.1% over the previous year. Among them, the general public budget revenue was 39.177 billion yuan, an increase of 5.2% over the previous year. Among the general public budget revenue, the tax revenue was 27.795 billion yuan, down 5.4% over the previous year. The annual general public budget expenditure was 77.54 billion yuan, a decrease of 5.8% over the previous year. Among the fiscal expenditures, the expenditures on business services, health, science and technology grew rapidly, among which the expenditures on business services were 718 million yuan, an increase of 23.8% over the previous year; Health expenditure was 9.102 billion yuan, an increase of 6.72% over the previous year; Expenditure on science and technology was 1.365 billion yuan, an increase of 3.41% over the previous year.
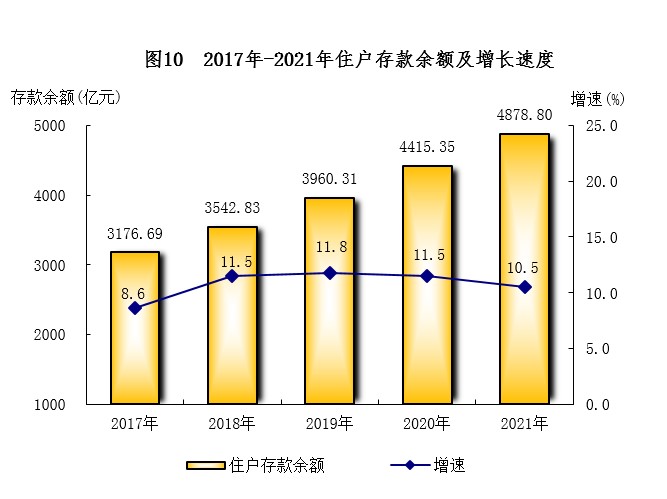
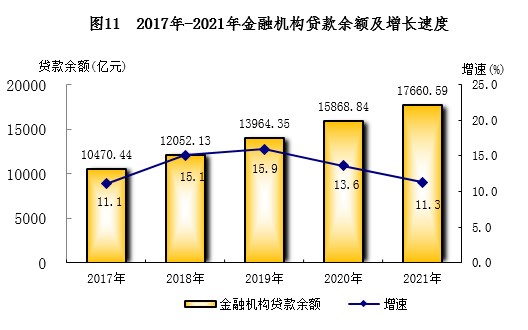
Finance:At the end of the year, the balance of RMB deposits in financial institutions in the city was 1,199.648 billion yuan, an increase of 4.3% over the previous year. Among them, the balance of household deposits was 487.88 billion yuan, up by 10.5% over the previous year. The balance of RMB loans of financial institutions was 1,766.059 billion yuan, an increase of 11.3 over the previous year.%。
Insurance:The annual premium income was 26.881 billion yuan, an increase of 9.2% over the previous year. Among them, property insurance premium income was 10.015 billion yuan, down 6.2% from the previous year; The premium income of life insurance, health insurance and accident insurance was 16.87 billion yuan, up by 20.8% over the previous year. In the whole year, various insurance claims and payments amounted to 8.553 billion yuan, of which 6.003 billion yuan was paid for property insurance business; Life insurance, health insurance and accidental injury insurance claims and payments of 2.55 billion yuan.
VIII. Transportation
Freight transportation:The total cargo transportation in the whole year was 429,285,500 tons, up by 16.8% over the previous year, of which the railway cargo transportation was 2,104,600 tons, up by 17.66% over the previous year. The volume of road freight transportation was 380,983,800 tons, an increase of 17.2% over the previous year; The waterway cargo transportation volume was 46.073 million tons, an increase of 12.9% over the previous year; The air cargo and mail throughput was 124,100 tons, an increase of 16% over the previous year.
Passenger transport:The total passenger transport volume was 70,833,900, up by 2.8% over the previous year, of which the railway passenger transport volume was 28,736,300, down by 17.8% over the previous year. Road passenger traffic was 36.36 million, down 6.8% from the previous year; The waterway passenger traffic volume was 189,600, an increase of 138.2% over the previous year; The number of air passengers was 5.544 million, an increase of 2.2% over the previous year.
Public transportation:At the end of the year, 4,515 practical public buses (electric vehicles) were in operation, an increase of 203 vehicles or 4.7% over the previous year. The total number of bus passengers was 227 million, an increase of 0.5% over the previous year. At the end of the year, the total length of rail transit lines was 128.2 kilometers, an increase of 20.2 kilometers or 18.8% over the previous year. The total number of rail transit passengers was 289 million, an increase of 38.6% over the previous year.
Income, consumption and social security of residents
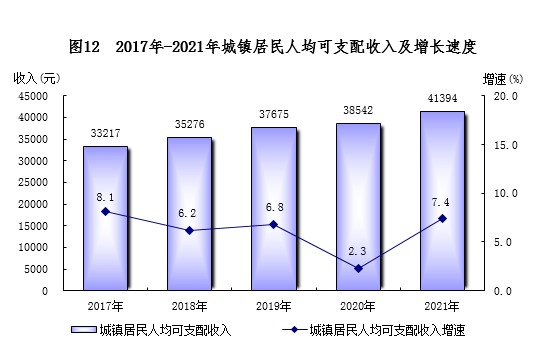
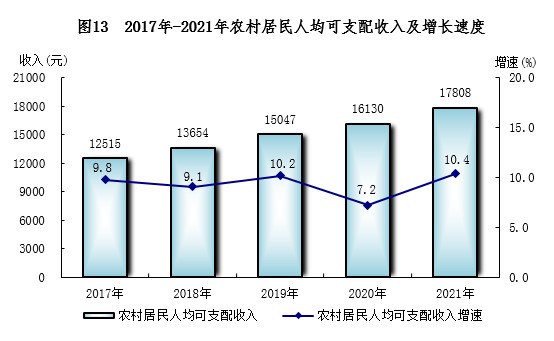
Life of urban and rural residents:In the whole year, the per capita disposable income of residents in the city was 32,679 yuan, an increase of 2,565 yuan or 8.5% over the previous year. According to the place of permanent residence, the per capita disposable income of urban residents was 41,394 yuan, an increase of 2,852 yuan or 7.4% over the previous year. The per capita disposable income of rural residents was 17,808 yuan, an increase of 1,678 yuan or 10.4% over the previous year.
Social security:At the end of the year, the number of people participating in the basic old-age insurance for urban workers (including enterprises, institutions and institutions) was 5,217,100, an increase of 542,600 over the end of the previous year. Among them, the number of people participating in the basic old-age insurance for urban workers was 2,061,800, an increase of 181,600 over the end of last year; The number of people participating in the basic old-age insurance for urban and rural residents was 3,155,300, an increase of 361,100 over the end of last year. The number of people participating in unemployment insurance was 1,113,100, an increase of 256,500 over the end of last year. At the end of the year, the number of people receiving unemployment insurance benefits in the city was 36,800. The number of people participating in industrial injury insurance was 1,223,800, an increase of 268,400 over the end of last year.
X. Education, Science and Technology and Health
Education:Vocational middle schools enrolled 38,300 students, 98,100 students and 25,700 graduates. Ordinary high schools enrolled 60,400 students and graduated 48,700 students. Ordinary junior high schools enrolled 111,500 students and graduated 98,100 students. Ordinary primary schools enrolled 142,100 students, 798,600 students and 110,100 graduates. There are 238 special education students, 1460 students and 231 graduates. There are 326,910 children in the park, and the enrollment rate of school-age children is 100%. There are 354 ordinary middle schools, 1,086 ordinary primary schools, 1,642 kindergartens and 10 special education schools. There are 34,183 full-time teachers in ordinary middle schools, 45,660 in ordinary primary schools, 20,099 in kindergartens and 383 in special education.
Technology:At the end of the year, there were 224 key achievement promotion projects, and 67 municipal science and technology projects were arranged, with a total investment of 227 million yuan. A total of 6,331 technical contracts were signed throughout the year, with a turnover of 39.094 billion yuan, an increase of 31.4% over the previous year.
Health and wellness:At the end of the year, there were 4,895 health institutions, including 279 hospitals, 2,987 clinics and 1,425 village clinics. At the end of the year, there were 85,500 health professionals in the city, including 30,900 licensed doctors and assistant licensed doctors and 39,900 registered nurses. There are 60,600 beds in medical and health institutions, including 45,900 beds in hospitals.
XI. Sports, Culture and Radio and Television
Sports:There are 12 public stadiums, 86 gymnasiums, 12,454 basketball courts, 679 football fields, 1,477 volleyball courts and 267 swimming pools. During the year, 288 sports events were held.
Culture:By the end of the year, there were 14 public libraries at or above the county level, 13 cultural centers, 5 museums and 102 township cultural stations. The public library has a collection of 3,431,600 books.
Radio and television:At the end of the year, there were 65 FM and TV transmitting stations, including 53 TV transmitting stations. At the end of the year, the comprehensive population coverage rate of radio programs and TV programs was 99.65% and 99.92% respectively.
XII. Energy production and others
On the fourth day of the year, the power generation of enterprises was 13.074 billion kWh, up by 27.88% over the previous year. Among them, the thermal power generation increased by 31.75% over the previous year, and the power generation of new energy sources (wind energy, solar energy, biomass and garbage incineration) increased by 55.5% over the previous year.
At the end of the year, there were 1,244,400 pipeline gas users, an increase of 12.9% over the previous year; There were 859,500 users of liquefied petroleum gas, an increase of 0.03% over the previous year; The total water supply was 719 million cubic meters, an increase of 7.3% over the previous year.
There were 2925 road traffic accidents in the whole year, down by 0.4% over the previous year; The number of criminal cases filed was 56,600, an increase of 2.3% over the previous year; There were 134,100 civil cases, an increase of 23.5% over the previous year.
?
Note:
1. The data in this bulletin are preliminary statistics.
2. The regional GDP, the added value of three industries, the industrial added value and the growth rate of agricultural output value are calculated at comparable prices; The growth rate of total industrial output value is calculated at current prices.
3. Industrial enterprises above designated size refer to all legal person industrial enterprises with annual main business income of 20 million yuan or more; Wholesale and retail enterprises above designated size refer to wholesale enterprises with annual main business income of 20 million yuan or more and retail enterprises with annual main business income of 5 million yuan or more.
4. Due to the rounding of some data, there is a situation that the total item is not equal to the total item.
5. Sources: The data of the total registered population, the number of road traffic accidents and criminal cases filed in this bulletin come from Nanning Public Security Bureau; Financial data comes from Nanning Finance Bureau; The data of prices and residents’ income come from Nanning investigation team of National Bureau of Statistics. Import and export data from Nanning Customs; The investment data comes from Nanning Investment Promotion Bureau; Financial data comes from Nanning Central Branch of China People’s Bank; Insurance data comes from Guangxi Supervision Bureau of China Banking Insurance Supervision Committee; Cultural data and radio and television data come from Nanning Municipal Bureau of Culture, Radio, Film and Tourism. Education data comes from Nanning Education Bureau; Passenger and cargo traffic data are from Nanning Transportation Bureau, Nanning Railway Bureau, Guangxi Coastal Railway Company and Guangxi Airport Management Group Co., Ltd. Nanning Wuxu International Airport; The data of birth rate, death rate, natural population growth rate and health data come from Nanning Health and Wellness Committee. Development zone data come from Nanning High-tech Industrial Development Zone, Nanning Economic and Technological Development Zone and Guangxi-ASEAN Economic and Technological Development Zone. Social security data comes from Nanning Human Resources and Social Security Bureau; The data of pipeline gas users, liquefied petroleum gas users and total water supply come from Nanning Housing and Urban-Rural Development Bureau. Data of civil cases come from Nanning Intermediate People’s Court; Sports data comes from Nanning Sports Bureau; Science and technology data comes from Nanning Science and Technology Bureau; Other data are from Nanning Municipal Bureau of Statistics.